
Geographical areas
Why not use districts or municipalities?
In the Netherlands Cancer Registry (NCR), the postcode of the patient's residence at the time of the cancer diagnosis is registered for each cancer diagnosis. It was a deliberate decision to classify areas based on postcodes and not districts or municipalities. The reason for this is that the location and size of postcode areas in the Netherlands remained more stable over time than those of neighbourhoods, districts or municipalities. Neighbourhoods and municipalities may expand or merge. Even though postcodes also change sometimes, it is easier to determine which old postcode corresponds to a new postcode area. A second reason for using postcode areas is that standard population data by age group has been available from the Central Bureau for Statistics since the 1990s. This information is essential because the number of cancer cases in a specific area is always related to the size of the population (and its distribution by age and gender) in that area.
Why not use 4-digit postcode areas?
We chose 3-digit postcode areas instead of 4-digit postcode areas (areas with the same 4 digits in the postcode) because the estimates would be more reliable at the 3-digit level (because of larger numbers of diagnoses per area). 4-digit postcode areas contain fewer people than the 3-digit postcode areas which they belong to. There are approximately 4000 4-digit postcode areas in the Netherlands. Geographic analysis over (that many) small areas can only be performed for common cancer types. For example, if there are 1,000 diagnoses per year for a particular cancer type, there will be many areas at the 4-digit postcode level where either no or very few diagnoses are made, making it impossible to reliably estimate the geographical variation in incidence. To analyse whether the diagnosis rate is higher or lower than expected, there must be a sufficient number of diagnoses (per area) to make a reliable estimate.
So, why is lung cancer shown at 4-digit postcode level?
We made an exception for lung cancer, for which we conducted the analyses at 4-digit postcode level. This is possible because lung cancer is one of the most common types of cancer in the Netherlands, thus providing a sufficient number of diagnoses to conduct reliable analyses at the 4-digit postcode level. Also, lung cancer is one of the cancer types for which geographical variation is present at the 4-digit postcode level, that is not apparent at the 3-digit postcode level. For other common cancer types, such as breast, colorectal and prostate cancer, analyses at the 4-digit postcode level are also possible. But these analyses are not shown because, unlike lung cancer, there is no additional variation observed at the 4-digit postcode level compared to the 3-digit postcode level. The patterns remain the same at both levels. In the following texts, we mainly refer to the 3-digit postcode level. In the case of lung cancer at the 4-digit postcode level, you can substitute '4-digit' postcode level in that context.
Adjustments to the 3-digit postcode areas.
The definition of 3-digit postcode areas came with some challenges. Several areas in the Netherlands share the same first three digits in their postcodes but are not directly adjacent to each other. This is the case, for example, for postcodes that start with 832. A part of these postcodes is located in Urk, while another part is nearly 30 km away in the vicinity of Vollenhove and Sint Jansklooster. In the Dutch Cancer Atlas, such areas were split up and analysed as separate entities. Therefore, one area is numbered 832.1 and the other area 832.2. The areas to which this applies are recognizable in the panel (by clicking on an area, this panel opens) of a region by the .1, .2, or .3 following the 3-digit postcode. These numbers (.1, .2, or .3) do not indicate anything about the 4-digit postcodes that are included in the area. But the panel shows which 4-digit postcodes are included in each 3-digit postcode area.
Another challenge arises from the fact that municipalities expand or merge over time. Because of this, postcodes sometimes change as well and old postcodes may fall under a new postcode area. This was, for example, the case in the municipalities Heusden and Oss. In those areas, new postcodes were added. Because we do not exactly know the population size and the number of cancer diagnoses for these new postcodes, these areas have been combined in the analyses with all the old towns and villages falling under the new municipality. This is the case for the following 4-digit postcodes:
For Heusden: 5156, 5157, 5354, 5255, 5255, and 5257 have been merged with 5256.
For Oss: 5352, 5353, 5355, 5356, 5357, 5358, and 5359 have been merged with 5371.
By clicking on an area, a panel opens displaying all 4-digit postcodes falling within the respective 3-digit postcode area.
Smoothing
In the estimation of the geographical variation shown in the Dutch Cancer Atlas ‘smoothing’ is used. This method is explained in Statistical model for cancer diagnoses. In short, for the estimation of the Standardized Incidence Ratio (SIR) of an area, not only data from that particular area but also of its neighbouring areas are used. This results in a more stable and precise estimate of the SIR. Essentially, all adjacent 3-digit postcode areas of area X are taken into account in the estimation of the SIR for area X. Additionally, a 'second shell' of adjacent areas is included in the calculation. The same principle applies to the 'first shell'; all areas bordering the areas of the first shell are considered. To illustrate, please refer to Figure 2a below, where the border areas for the 3-digit postcode region 101 (highlighted in pink) in Amsterdam are depicted in purple ('first shell') and red ('second shell').
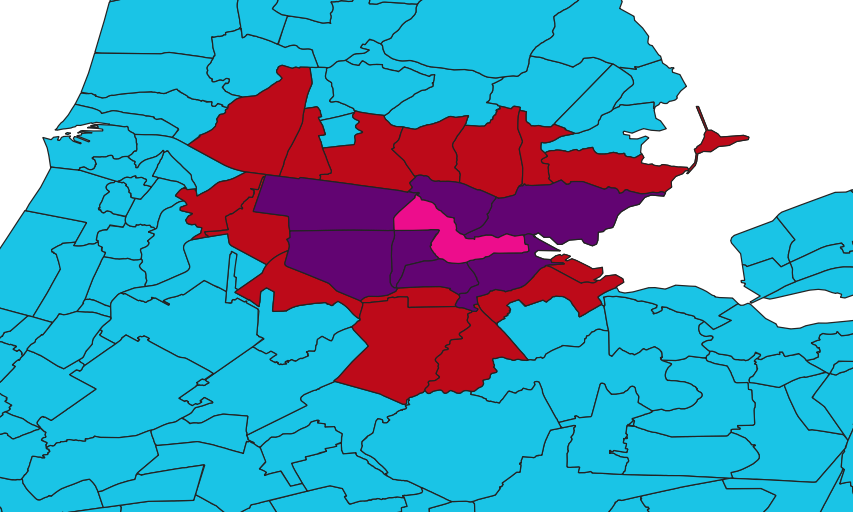
Figure 2a. Adjacent areas for the 3-digit postcode region 101 in Amsterdam
As for the islands, we ran into the issue that they do not have direct neighbours. Also, Urk had too few neighbouring areas relative to its population size. As a result, we could not get reliable estimates for these areas. This was solved by manually assigning the areas that should be treated as their ‘neighbours.'
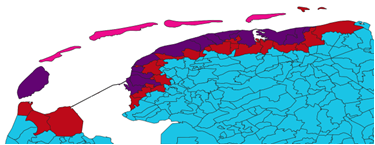
For the analyses at the 3-digit postcode level, the islands were combined, taking into account the population size of the different islands. Thus, Texel is considered one area and Vlieland, Terschelling, Ameland and Schiermonnikoog were merged into one area for analysis. Rottumerplaat was combined with the 3-digit postcode region 998 in the province of Groningen. To illustrate, refer to Figures 2b and 2c below, where the border areas for the 3-digit postcode regions 179 and 888 (highlighted in pink) are shown in purple ('first shell') and red ('second shell').
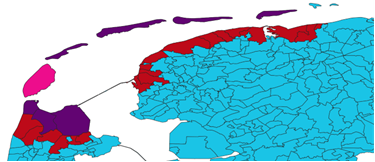
Figure 2b. Neighbouring areas for the 3-digit area 179 Texel
.png)
Figure 2c. Neighbouring areas for Vlieland, Terschelling, Ameland and Schiermonnikoog (3-digit postcode region 888)
For the analysis at the 4-digit postcode level, the adjacent areas of the island itself were included, along with the 'adjacent' 4-digit postcode area of the neighbouring island. Additionally, the area of the departure port for the ferry to the island was designated as an adjacent area. For example, for Vlieland (8899), the following areas are considered adjacent: De Cocksdorp (1795), De Spiker and the Industrial Area Hermus (8861) and Terschelling West (8881). To illustrate, refer to Figure 2d below, where the border areas for the 4-digit postcode region 8899 (Vlieland, highlighted in pink) are shown in purple ('first shell') and red ('second shell').
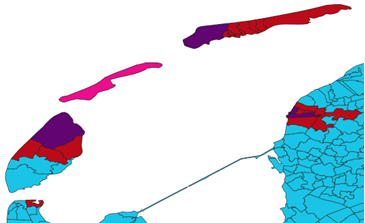
Figure 2d. Adjacent areas for Vlieland at the 4-digit postcode level
What are the black areas with grey crosses on the map?
In the Dutch Cancer Atlas, some pieces of the map are missing. These areas are shown as black regions with light grey crosses. These are areas where either no people live or there are too few residents to calculate a reliable estimate. For example, this is the case for the port of Rotterdam and the Maasvlakte on the map at the 3-digit postcode level. Similarly, on the map at the 4-digit postcode level, this is for instance the case on the south side of Eindhoven or in Schokland in the Noordoostpolder.